The Scope of Diagnosed Dementia in the United States
Executive Summary
The Dementia DataHub analyzes Medicare Fee-for-Service (FFS) claims and Medicare Advantage encounter data to report the prevalence, incidence, and important outcomes of diagnosed dementia (including Alzheimer’s Disease and related dementias), at the national, state, and county level.
At the heart of this system are case definitions that use diagnosis and drug codes observed across three years of Medicare data to identify and classify dementia cases into three mutually exclusive categories:
- Highly likely dementia: two or more dementia-specific diagnosis codes
- Likely dementia: exactly one dementia-specific diagnosis code
- Possible dementia: the presence of codes that may be related to dementia, but no codes specifically for dementia
In 2021, across all ages, we found that over 8.3 million Medicare beneficiaries, representing 13.3 percent of all enrollees, had evidence of Alzheimer's disease or related dementias based on any of the three categories, which was a 0.6 percent increase from 2020. Of these beneficiaries, 5.5 million (8.8 percent of enrollees) had at least one dementia-specific diagnosis code (at least Likely dementia) suggesting they likely had dementia, including 4.4 million who had two codes and are considered highly likely to have dementia. Among beneficiaries ages 65 and older, a total of 14.2 percent of beneficiaries had any evidence of dementia with 7.7 percent of beneficiaries categorized as highly likely (7.7 percent) or likely (1.9 percent) to have dementia, and 4.5 percent of beneficiaries categorized as possible dementia.
Considering only beneficiaries ages 65 and older, the incidence of dementia diagnosis in 2021 was 5.6 percent, a 0.6 percentage point increase from 2020. The annual mortality rate among beneficiaries ages 65 and older and diagnosed with dementia was 16.1 percent, a decrease of 1.7 percent points. Among beneficiaries ages 65 and older diagnosed with dementia, the prevalence of diagnosed COVID-19 infection was 13.6 percent, a decrease of 0.9 percentage points compared to 2020. Among beneficiaries ages 65 and older diagnosed with dementia in 2021 30.6 percent were hospitalized at least one time, 14.1% had a short-stay nursing visit, 9.4 percent had a long-stay nursing visit. Medicare beneficiaries aged 65 and older diagnosed with dementia experienced a rate of 501 hospital discharges per 1,000 beneficiaries in 2021. Among FFS beneficiaries ages 65 and older diagnosed with dementia, average all-cause Medicare payments were $26,270 per person in 2021, an increase of $1,500 percent compared to 2020. Data for hospitalization, hospital discharges, and short- and long-term nursing stays were not collected in 2020.
Our system provides data visualizations and public use files with information about the number and percentage of beneficiaries in each category that meet each case definition by demographic and geographic strata. While diagnosis codes are not as accurate as the gold-standard of physician ascertainment, and do not capture undiagnosed cases, when applied to national Medicare data they can provide nationally representative data on the burden, trends, and disparities in different outcomes of dementia at the state and county level.
- In 2021, an estimated 4.2 million Medicare beneficiaries aged 65 and older were characterized as “Highly Likely”, 1.1 million were “Likely”, and 2.5 million were “Possible” to have dementia according to our system case definitions, corresponding to 7.7 percent, 1.9 percent, and 4.5 percent of all Medicare beneficiaries aged 65 and older.
- Among beneficiaries aged 65 and older, the prevalence of “Highly Likely” dementia was 7.1 percent in the FFS program as compared to 8.5 percent in the Medicare Advantage program.
- Among beneficiaries aged 65 and older, the prevalence of “Highly Likely” was 8.9 percent among women as compared to 6.3 percent among men. Some of this difference is explained by the different age distributions of men and women within Medicare.
- Among beneficiaries aged 65 and older, the prevalence of “Highly Likely” dementia was highest for Hispanics (9.7 percent), followed by African Americans (9.5 percent), American Indian/Alaskan Native Natives (7.7 percent), Non-Hispanic Whites (7.4 percent), Asian or Pacific Islanders (7.1 percent), non-Hispanic Other races (7.0 percent), and beneficiaries with unknown race and ethnicity (2.4 percent). Some of these differences are explained by the different age distributions of different race and ethnicity groups within Medicare.
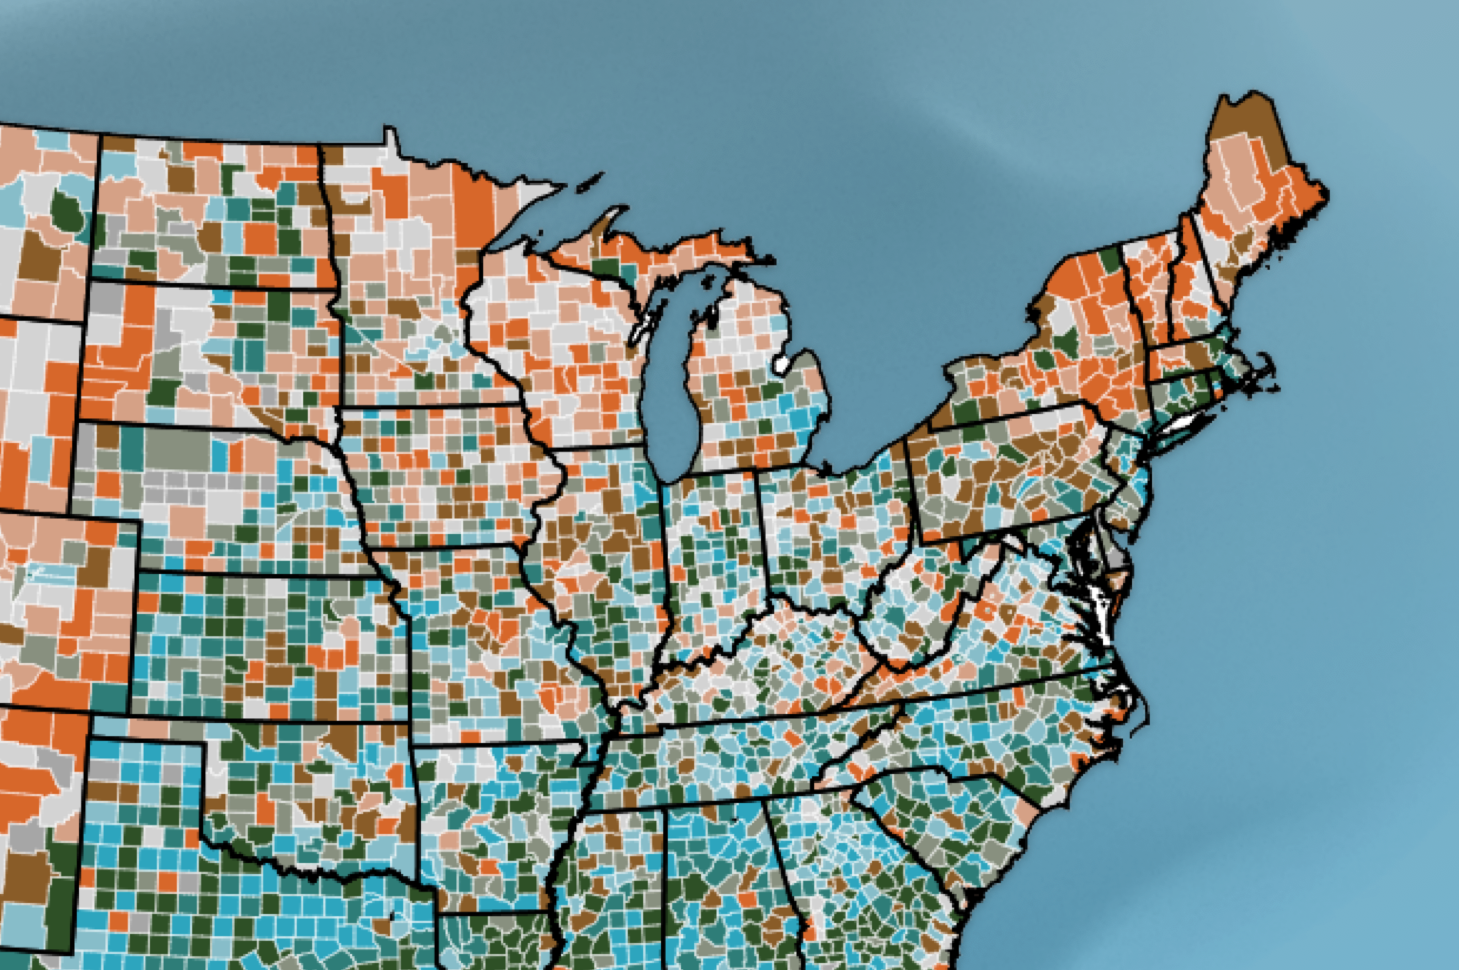
- Among beneficiaries aged 65 and older, Puerto Rico (20.0 percent), Mississippi (17.1 percent), Florida (17.1 percent), Arkansas (16.2 percent), and Texas (16.0 percent) had the highest rates of “Any Dementia” dementia. Wyoming (9.4 percent, Alaska (9.8 percent), Montana (10.3 percent), South Dakota (10.4 percent), and Vermont (10.9 percent) had the lowest rates.
- The incidence of dementia among Medicare beneficiaries aged 65 and older was 5.6 percent in 2021, including 4.9 percent among beneficiaries enrolled in FFS and 6.5 percent among beneficiaries enrolled in Medicare Advantage plans.
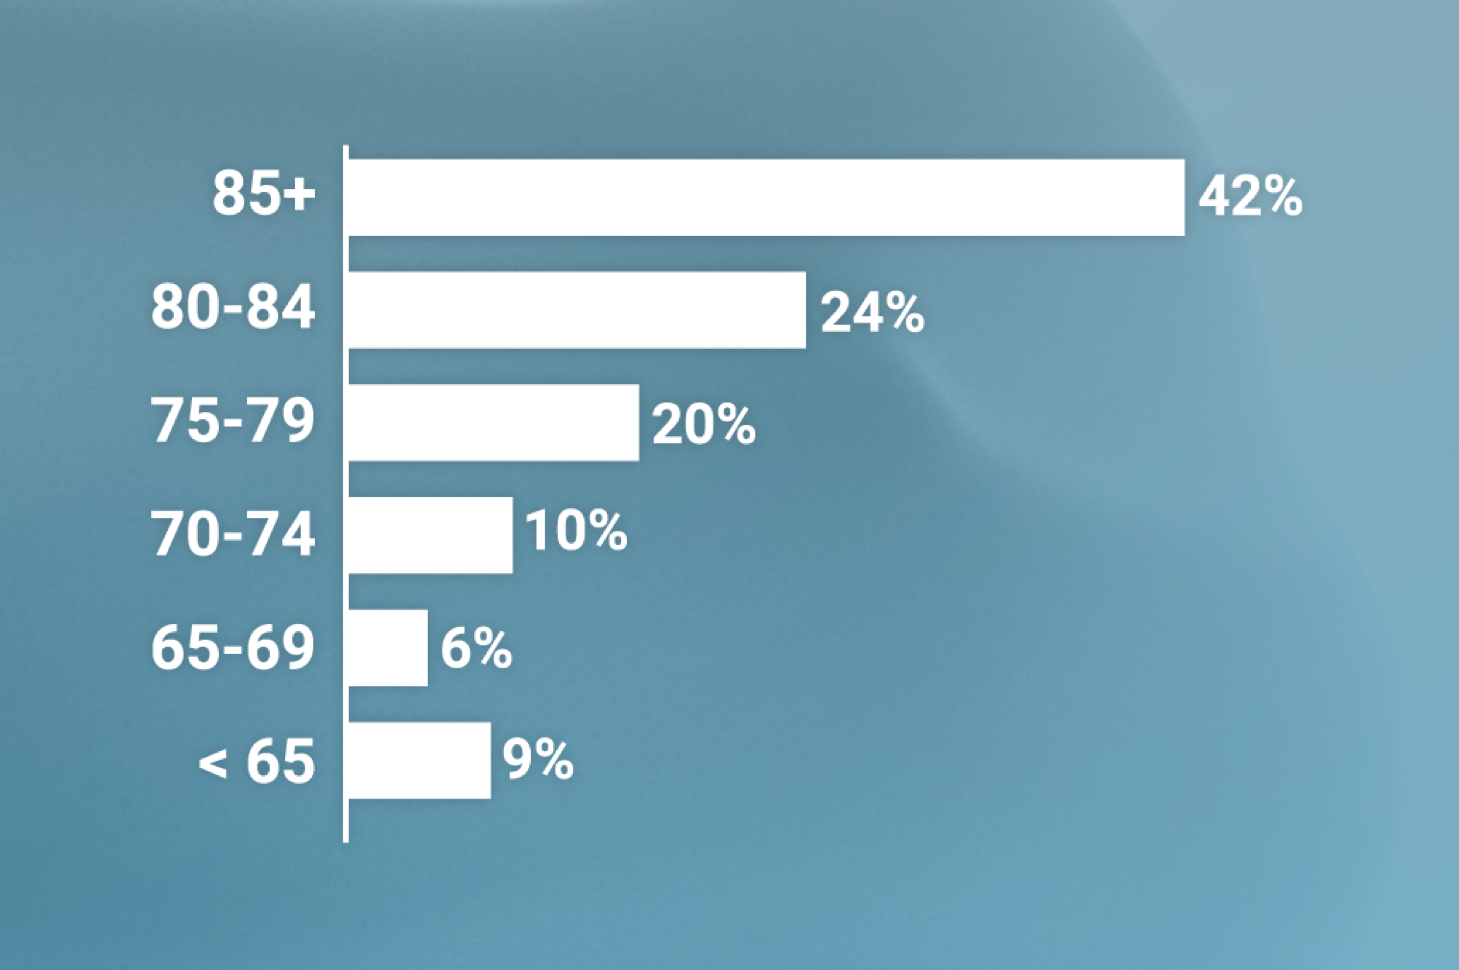
- Incidence increased from 2.1 percent among beneficiaries aged 65-69 to 14.7 percent among those aged 85 and older.
- Among beneficiaries aged 65 and older, incidence was highest among African Americans (6.6 percent) and Hispanics (6.5 percent), and lowest among Asian and Pacific Islanders (4.9 percent), Other races (5.2 percent), and beneficiaries with unknown race (2.5 percent).
- The mortality rate among beneficiaries aged 65 and older diagnosed with dementia was 16.1 percent, a 1.7 percentage point decrease from 2020.
- Among beneficiaries aged 65 and older, COVID-19 infections increased from 12.9 percent in 2020 to 13.6 percent in 2021.
- Among beneficiaries aged 65 and older and diagnosed with dementia in 2021 30.6 percent were hospitalized, 14.1 percent had a short-stay nursing visit, 9.4 percent had a long-stay nursing visit.
- Among FFS beneficiaries ages 65 and older with any type of dementia, average all-cause Medicare payments were $26,270 per person in 2021, an increase of 6.1 percent from 2020.
Background
The Dementia DataHub serves as a national statistics and data system focused on measuring the scope and outcomes of dementia in administrative data systems including Medicare. The project focuses on creating and validating case definitions to identify dementia, including Alzheimer’s disease and other related dementias using diagnosis and drug codes in billing claims and medical encounter data. The DataHub applies these case definitions to Medicare data to analyze and report national, state, and county measures of diagnosed dementia prevalence and incidence, and mortality, COVID-19 infections, and all-cause payments among people with prevalent dementia.
The Dementia DataHub is a joint effort led by NORC at the University of Chicago, with partner support from George Washington University’s Milken Institute School of Public Health and KPMG LLC. The DataHub is funded by the National Institutes on Aging through Grants R01-AG-075730 and R33-AG-094611.
Dementia DataHub estimates should be considered provisional, pending revisions and adjudications of administrative data records, and possible future revisions or enhancements to the system’s dementia case definitions.
Case Definition
The Dementia DataHub developed case definitions based on diagnosis and prescription drug codes to identify people diagnosed with dementia. We reviewed existing case definitions and categorized them based on their frequency of inclusion in prior case definitions. Expert input was used to remove certain codes from the case definitions. We are conducting ongoing validation studies to assess the accuracy of these case definitions. Therefore, case definitions may be revised over time as new information becomes available.
- Highly Likely Dementia is defined as a person having a dementia-specific diagnosis code on at least two separate dates over three-year period.
- Likely Dementia is defined as a person having a dementia-specific diagnosis code indicating dementia on only one date over three-year period.
- Highly Likely and Likely Dementia is defined as the sum of highly likely and likely dementia.
- Possible Dementia is defined as a person having diagnosis codes that may indicate dementia over three-year period, or a prescription drug indicated for dementia without a corresponding dementia diagnosis code. These people may have dementia, or they may not.
- Any Dementia is defined as the sum of Highly Likely, Likely, and Possible dementia.
Methods
Developing Case Definitions
We developed our case definitions by aggregating codes used by 20 different previously published algorithms and the CMS Chronic Condition Warehouse definition, sorting by frequency of inclusion in prior case definitions, reviewing individual codes with clinical experts, and organizing codes into those that are directly related to dementia, Alzheimer's disease and other related dementias, and others that may indicate dementia but do not specifically state dementia or Alzheimer's disease. We used other Medicare evidence to provide support for these definitions.
Data Sources
We used 100 percent of the 2018, 2019 and 2020 Medicare fee-for-service (FFS) inpatient, outpatient, carrier, Skilled Nursing Facility (SNF), Home Health Agency (HHA), and hospice claims; Medicare Advantage (MA) inpatient, outpatient, carrier, SNF, and HHA encounter data; and Medicare Part D Prescription Drug Event (PDE) data.
Inclusion Criteria
Our estimates include any Medicare beneficiaries with at least Part A (the premium-free Medicare benefit) enrollment who was alive and enrolled as of January 1, 2021. We excluded people with missing sex, and invalid U.S. state or territory codes.
Analyzing Data
We applied the case definitions to included datasets using ICD-10 diagnosis codes and NDC drug codes in any position on the claim. We analyze and report outcomes by calendar year. To meet privacy suppression requirements (see below), estimated changes across years are only supported for age groups 65 and older. Estimates by race and ethnicity cannot be compared across years.
Suppression
To ensure the privacy of individuals in Medicare, we suppressed any data cell value with a numerator or denominator count that was less than 11. We additionally suppressed related cells that could be used in combination to construct a cell count less than 11. Suppression is most extreme for results for the 0 to 64 category. To preserve the 65+ totals, we no longer produce estimates for those younger than 65 for any outcome other than prevalence.
Public Use Files
All data used in this site are available for independent analysis as a public use file. If you are interested in accessing the public use data, please email the project team at Dementiadatahub@norc.org.
Prevalence Tables
Prevalence of Diagnosed Dementia Among All Medicare Beneficiaries Aged 65 and Older, 2021
Total
Prevalence indicated by both percentage and (count)
| All Claims & Encounter Data | Total | Highly Likely + Likely (1+ Specific Diagnoses) | Highly Likely Dementia (2+ Specific Diagnoses) | Likely Dementia (1 Specific Diagnosis | Possible Dementia (Less Specific Diagnosis) |
|---|---|---|---|---|---|
| Total | 14.18% (7,748,303) | 9.65% (5,272,837) | 7.71% (4,216,647) | 1.93% (1,056,190) | 4.53% (2,475,466) |
By Program
| Program Name | Total | Highly Likely + Likely (1+ Specific Diagnoses) | Highly Likely Dementia (2+ Specific Diagnoses) | Likely Dementia (1 Specific Diagnosis) | Possible Dementia (Less Specific Diagnosis) |
|---|---|---|---|---|---|
| Medicare FFS | 12.83% (3,984,524) | 8.78% (2,729,116) | 7.14% (2,216,970) | 1.65% (512,146) | 4.04% (1,255,408) |
| Medicare Advantage | 15.95% (3,763,779) | 10.78% (2,543,721) | 8.48% (1,999,677) | 2.31% (544,044) | 5.17% (1,220,058) |
By Age
| Age Range | Total | Highly Likely + Likely (1+ Specific Diagnoses) | Highly Likely Dementia (2+ Specific Diagnoses) | Likely Dementia (1 Specific Diagnosis) | Possible Dementia (Less Specific Diagnosis) |
|---|---|---|---|---|---|
| 65-69 | 4.78% (714,121) | 2.51% (374,256) | 1.70% (253,492) | 0.81% (120,764) | 2.28% (339,865) |
| 70-74 | 7.94% (1,215,229) | 4.52% (691,320) | 3.26% (499,321) | 1.25% (191,999) | 3.42% (523,909) |
| 75-79 | 13.94% (1,488,562) | 8.88% (948,798) | 6.87% (733,263) | 2.02% (215,535) | 5.05% (539,764) |
| 80-84 | 23.00% (1,564,152) | 16.19% (1,101,211) | 13.16% (894,816) | 3.03% (206,395) | 6.81% (462,941) |
| 85+ | 39.87% (2,766,239) | 31.09% (2,157,252) | 26.46% (1,835,755) | 4.63% (321,497) | 8.78% (608,987) |
By Sex
| Sex | Total | Highly Likely + Likely (1+ Specific Diagnoses) | Highly Likely Dementia (2+ Specific Diagnoses) | Likely Dementia (1 Specific Diagnosis) | Possible Dementia (Less Specific Diagnosis) |
|---|---|---|---|---|---|
| Male, 65+ | 12.43% (3,056,661) | 8.14% (2,002,412) | 6.32% (1,554,917) | 1.82% (447,495) | 4.29% (1,054,249) |
| Female, 65+ | 15.60% (4,691,642) | 10.88% (3,270,425) | 8.85% (2,661,730) | 2.02% (608,695) | 4.73% (1,421,217) |
By Race/Ethnicity
| Racial/Ethnic Identification | Total | Highly Likely + Likely (1+ Specific Diagnoses) | Highly Likely Dementia (2+ Specific Diagnoses) | Likely Dementia (1 Specific Diagnosis) | Possible Dementia (Less Specific Diagnosis) |
|---|---|---|---|---|---|
| African American, 65+ | 16.77% (837,930) | 11.93% (596,246) | 9.5% (473,909) | 2.45% (122,337) | 4.84% (241,684) |
| American Indian/Alaskan Native, 65+ | 14.37% (27,378) | 9.82% (18,714) | 7.7% (14,576) | 2.17% (4,138) | 4.55% (8,664) |
| Asian or Pacific Islander, 65+ | 12.36% (250,588) | 9.09% (184,282) | 7.1% (142,963) | 2.04% (41,319) | 3.27% (66,306) |
| Hispanic (any race), 65+ | 16.69% (828,640) | 12.31% (611,097) | 9.7% (480,510) | 2.63% (130,587) | 4.38% (217,543) |
| Other, 65+ | 12.90% (61,843) | 8.88% (42,579) | 7.0% (33,703) | 1.85% (8,876) | 4.02% (19,264) |
| Unknown, 65+ | 5.97% (65,518) | 3.35% (36,789) | 2.4% (26,836) | 0.91% (9,953) | 2.62% (28,729) |
| White, 65+ | 13.88% (5,676,406) | 9.25% (3,783,130) | 7.4% (3,044,150) | 1.81% (738,980) | 4.63% (1,893,276) |
Incidence of Diagnosed Dementia Among All Medicare Beneficiaries Aged 65 and Older, 2021
Total
Prevalence indicated by both percentage and (count)
| All Claims & Encounter Data | Total | Highly Likely + Likely (1+ Specific Diagnoses) | Highly Likely Dementia (2+ Specific Diagnoses) | Likely Dementia (1 Specific Diagnosis | Possible Dementia (Less Specific Diagnosis) |
|---|---|---|---|---|---|
| Total | 5.61% (3,063,938) | 3.27% (1,788,423) | 2.20% (1,203,631) | 1.07% (584,792) | 2.33% (1,275,515) |
By Program
| Program Name | Total | Highly Likely + Likely (1+ Specific Diagnoses) | Highly Likely Dementia (2+ Specific Diagnoses) | Likely Dementia (1 Specific Diagnosis) | Possible Dementia (Less Specific Diagnosis) |
|---|---|---|---|---|---|
| Medicare FFS | 4.90% (1,523,039) | 2.85% (886,357) | 1.96% (609,543) | 0.89% (276,814) | 2.05% (636,682) |
| Medicare Advantage | 6.53% (1,540,899) | 3.82% (902,066) | 2.52% (594,088) | 1.31% (307,978) | 2.71% (638,833) |
By Age
| Age Range | Total | Highly Likely + Likely (1+ Specific Diagnoses) | Highly Likely Dementia (2+ Specific Diagnoses) | Likely Dementia (1 Specific Diagnosis) | Possible Dementia (Less Specific Diagnosis) |
|---|---|---|---|---|---|
| 65-69 | 2.15% (320,587) | 1.04% (154,702) | 0.60% (90,232) | 0.43% (64,470) | 1.11% (165,885) |
| 70-74 | 3.30% (504,638) | 1.72% (262,623) | 1.06% (162,001) | 0.66% (100,622) | 1.58% (242,015) |
| 75-79 | 5.67% (605,105) | 3.20% (341,306) | 2.09% (223,419) | 1.10% (117,887) | 2.47% (263,799) |
| 80-84 | 9.04% (614,835) | 5.45% (370,369) | 3.73% (253,566) | 1.72% (116,803) | 3.59% (244,466) |
| 85+ | 14.68% (1,018,773) | 9.50% (659,423) | 6.84% (474,413) | 2.67% (185,010) | 5.18% (359,350) |
By Sex
| Sex | Total | Highly Likely + Likely (1+ Specific Diagnoses) | Highly Likely Dementia (2+ Specific Diagnoses) | Likely Dementia (1 Specific Diagnosis) | Possible Dementia (Less Specific Diagnosis) |
|---|---|---|---|---|---|
| Male | 5.14% (1,265,124) | 2.99% (734,508) | 1.97% (485,019) | 1.01% (249,489) | 2.16% (530,616) |
| Female | 5.98% (1,798,814) | 3.51% (1,053,915) | 2.39% (718,612) | 1.12% (335,303) | 2.48% (744,899) |
By Race/Ethnicity
| Racial/Ethnic Identification | Total | Highly Likely + Likely (1+ Specific Diagnoses) | Highly Likely Dementia (2+ Specific Diagnoses) | Likely Dementia (1 Specific Diagnosis) | Possible Dementia (Less Specific Diagnosis) |
|---|---|---|---|---|---|
| African American | 6.57% (328,486) | 3.88% (193,921) | 2.59% (129,361) | 1.29% (64,560) | 2.69% (134,565) |
| American Indian/Alaskan Native | 5.78% (11,020) | 3.43% (6,544) | 2.29% (4,354) | 1.15% (2,190) | 2.35% (4,476) |
| Asian or Pacific Islander | 4.88% (98,939) | 3.18% (64,513) | 2.04% (41,328) | 1.14% (23,185) | 1.70% (34,426) |
| Hispanic (any race) | 6.48% (321,506) | 4.13% (205,139) | 2.68% (132,925) | 1.45% (72,214) | 2.34% (116,367) |
| Other | 5.17% (24,772) | 3.11% (14,911) | 2.07% (9,934) | 1.04% (4,977) | 2.06% (9,861) |
| Unknown | 2.46% (26,992) | 1.25% (13,715) | 0.77% (8,492) | 0.48% (5,223) | 1.21% (13,277) |
| White | 5.51% (2,252,223) | 3.15% (1,289,680) | 2.14% (877,237) | 1.01% (412,443) | 2.35% (962,543) |
Mortality Among Medicare Beneficiaries with Diagnosed Dementia, Aged 65 and Older, 2021
Total
Prevalence indicated by both percentage and (count)
| All Claims & Encounter Data | Total | Highly Likely + Likely (1+ Specific Diagnoses) | Likely Dementia (1 Specific Diagnosis) | Highly Likely Dementia (2+ Specific Diagnoses) | Possible Dementia (Less Specific Diagnosis) |
|---|---|---|---|---|---|
| Total | 16.13% (1,249,685) | 19.38% (1,021,961) | 13.47% (142,317) | 20.86% (879,644) | 9.20% (227,724) |
By Program
| Program Name | Total | Highly Likely + Likely (1+ Specific Diagnoses) | Likely Dementia (1 Specific Diagnosis) | Highly Likely Dementia (2+ Specific Diagnoses) | Possible Dementia (Less Specific Diagnosis) |
|---|---|---|---|---|---|
| Medicare FFS | 17.87% (712,187) | 21.54% (587,879) | 15.56% (79,699) | 22.92% (508,180) | 9.90% (124,308) |
| Medicare Advantage | 14.28% (537,498) | 17.06% (434,082) | 11.51% (62,618) | 18.58% (371,464) | 8.48% (103,416) |
By Age
| Age Range | Total | Highly Likely + Likely (1+ Specific Diagnoses) | Likely Dementia (1 Specific Diagnosis) | Highly Likely Dementia (2+ Specific Diagnoses) | Possible Dementia (Less Specific Diagnosis) |
|---|---|---|---|---|---|
| <65 | 7.99% (44,488) | 9.36% (24,140) | 7.51% (7,222) | 10.46% (16,918) | 6.80% (20,348) |
| 65-69 | 9.52% (67,992) | 11.22% (41,981) | 8.96% (10,824) | 12.29% (31,157) | 7.65% (26,011) |
| 70-74 | 10.03% (121,880) | 12.26% (84,774) | 9.25% (17,762) | 13.42% (67,012) | 7.08% (37,106) |
| 75-79 | 11.75% (174,927) | 14.19% (134,653) | 10.29% (22,186) | 15.34% (112,467) | 7.46% (40,274) |
| 80-84 | 14.80% (231,427) | 17.36% (191,168) | 12.71% (26,231) | 18.43% (164,937) | 8.70% (40,259) |
| 85+ | 23.62% (653,459) | 26.39% (569,385) | 20.32% (65,314) | 27.46% (504,071) | 13.81% (84,074) |
By Sex
| Sex | Total | Highly Likely + Likely (1+ Specific Diagnoses) | Likely Dementia (1 Specific Diagnosis) | Highly Likely Dementia (2+ Specific Diagnoses) | Possible Dementia (Less Specific Diagnosis) |
|---|---|---|---|---|---|
| Male | 17.47% (534,128) | 21.07% (421,905) | 15.50% (69,358) | 22.67% (352,547) | 10.64% (112,223) |
| Female | 15.25% (715,557) | 18.35% (600,056) | 11.99% (72,959) | 19.80% (527,097) | 8.13% (115,501) |
By Race/Ethnicity
| Racial/Ethnic Identification | Total | Highly Likely + Likely (1+ Specific Diagnoses) | Likely Dementia (1 Specific Diagnosis) | Highly Likely Dementia (2+ Specific Diagnoses) | Possible Dementia (Less Specific Diagnosis) |
|---|---|---|---|---|---|
| African American | 15.40% (129,036) | 18.04% (107,560) | 13.06% (15,972) | 19.33% (91,588) | 8.89% (21,476) |
| American Indian/Alaskan Native | 18.58% (5,088) | 21.52% (4,027) | 17.16% (710) | 22.76% (3,317) | 12.25% (1,061) |
| Asian or Pacific Islander | 11.57% (28,997) | 13.37% (24,642) | 9.02% (3,725) | 14.63% (20,917) | 6.57% (4,355) |
| Hispanic (any race) | 11.68% (96,757) | 13.51% (82,549) | 9.22% (12,043) | 14.67% (70,506) | 6.53% (14,208) |
| Other | 13.35% (8,254) | 15.96% (6,796) | 11.10% (985) | 17.24% (5,811) | 7.57% (1,458) |
| Unknown | 8.44% (5,528) | 10.61% (3,904) | 7.36% (733) | 11.82% (3,171) | 5.65% (1,624) |
| White | 17.19% (976,025) | 20.95% (792,483) | 14.63% (108,149) | 22.48% (684,334) | 9.69% (183,542) |
COVID-19 Infections Among Medicare Beneficiaries Diagnosed with Dementia, Aged 65 and Older, 2021
Total
Prevalence indicated by both percentage and (count)
| All Claims & Encounter Data | Total | Highly Likely + Likely (1+ Specific Diagnoses) | Likely Dementia (1 Specific Diagnosis) | Highly Likely Dementia (2+ Specific Diagnoses) | Possible Dementia (less specific diagnosis) |
|---|---|---|---|---|---|
| Total | 13.59% (1,053,060) | 15.05% (793,457) | 11.83% (124,975) | 15.85% (668,482) | 10.49% (259,603) |
By Program
| Program Name | Total | Highly Likely + Likely (1+ Specific Diagnoses) | Likely Dementia (1 Specific Diagnosis) | Highly Likely Dementia (2+ Specific Diagnoses) | Possible Dementia (Less Specific Diagnosis) |
|---|---|---|---|---|---|
| Medicare FFS | 14.82% (590,432) | 16.66% (454,685) | 12.79% (65,482) | 17.56% (389,203) | 10.81% (135,747) |
| Medicare Advantage | 12.29% (462,628) | 13.32% (338,772) | 10.94% (59,493) | 13.97% (279,279) | 10.15% (123,856) |
By Age
| Age Range | Total | Highly Likely + Likely (1+ Specific Diagnoses) | Likely Dementia (1 Specific Diagnosis) | Highly Likely Dementia (2+ Specific Diagnoses) | Possible Dementia (Less Specific Diagnosis) |
|---|---|---|---|---|---|
| <65 | 15.09% (84,037) | 17.12% (44,174) | 14.90% (14,330) | 18.44% (29,844) | 13.33% (39,863) |
| 65-69 | 13.86% (98,984) | 15.71% (58,793) | 13.19% (15,931) | 16.91% (42,862) | 11.83% (40,191) |
| 70-74 | 13.10% (159,202) | 14.76% (102,007) | 12.18% (23,388) | 15.75% (78,619) | 10.92% (57,195) |
| 75-79 | 12.91% (192,103) | 14.35% (136,117) | 11.63% (25,071) | 15.14% (111,046) | 10.37% (55,986) |
| 80-84 | 13.29% (207,916) | 14.66% (161,446) | 11.47% (23,677) | 15.40% (137,769) | 10.04% (46,470) |
| 85+ | 14.27% (394,855) | 15.53% (335,094) | 11.48% (36,908) | 16.24% (298,186) | 9.81% (59,761) |
By Sex
| Sex | Total | Highly Likely + Likely (1+ Specific Diagnoses) | Likely Dementia (1 Specific Diagnosis) | Highly Likely Dementia (2+ Specific Diagnoses) | Possible Dementia (Less Specific Diagnosis) |
|---|---|---|---|---|---|
| Male | 13.56% (414,428) | 15.04% (301,185) | 12.32% (55,138) | 15.82% (246,047) | 10.74% (113,243) |
| Female | 13.61% (638,632) | 15.05% (492,272) | 11.47% (69,837) | 15.87% (422,435) | 10.30% (146,360) |
By Race/Ethnicity
| Racial/Ethnic Identification | Total | Highly Likely + Likely (1+ Specific Diagnoses) | Likely Dementia (1 Specific Diagnosis) | Highly Likely Dementia (2+ Specific Diagnoses) | Possible Dementia (Less Specific Diagnosis) |
|---|---|---|---|---|---|
| African American | 14.66% (122,811) | 16.12% (96,108) | 12.59% (15,404) | 17.03% (80,704) | 11.05% (26,703) |
| American Indian/Alaskan Native | 16.43% (4,498) | 17.63% (3,299) | 14.89% (616) | 18.41% (2,683) | 13.84% (1,199) |
| Asian or Pacific Islander | 8.99% (22,517) | 9.72% (17,908) | 7.55% (3,120) | 10.34% (14,788) | 6.95% (4,609) |
| Hispanic (any race) | 13.20% (109,375) | 13.61% (83,185) | 11.97% (15,631) | 14.06% (67,554) | 12.04% (26,190) |
| Other | 11.29% (6,981) | 12.46% (5,306) | 9.88% (877) | 13.14% (4,429) | 8.69% (1,675) |
| Unknown | 11.74% (7,691) | 13.55% (4,986) | 11.14% (1,109) | 14.45% (3,877) | 9.42% (2,705) |
| White | 13.73% (779,187) | 15.40% (582,665) | 11.94% (88,218) | 16.24% (494,447) | 10.38% (196,522) |
Any Hospitalization Rate Among Medicare Beneficiaries Diagnosed with Dementia
Total
Prevalence indicated by both percentage and (count)
| All Claims & Encounter Data | Total | Highly Likely + Likely (1+ Specific Diagnoses) | Likely Dementia (1 Specific Diagnosis) | Highly Likely Dementia (2+ Specific Diagnoses) | Possible Dementia (Less Specific Diagnosis) |
|---|---|---|---|---|---|
| Total | 30.64% (2,374,205) | 31.58% (1,331,697) | 31.05% (327,949) | 31.48% (1,659,646) | 28.87% (714,559) |
By Program
| Program Name | Total | Highly Likely + Likely (1+ Specific Diagnoses) | Likely Dementia (1 Specific Diagnosis) | Highly Likely Dementia (2+ Specific Diagnoses) | Possible Dementia (Less Specific Diagnosis) |
|---|---|---|---|---|---|
| Medicare FFS | 32.80% (1,307,069) | 33.49% (742,552) | 34.53% (176,819) | 33.69% (919,371) | 30.88% (387,698) |
| Medicare Advantage | 28.35% (1,067,136) | 29.46% (589,145) | 27.78% (151,130) | 29.10% (740,275) | 26.79% (326,861) |
By Age
| Age Range | Total | Highly Likely + Likely (1+ Specific Diagnoses) | Likely Dementia (1 Specific Diagnosis) | Highly Likely Dementia (2+ Specific Diagnoses) | Possible Dementia (Less Specific Diagnosis) |
|---|---|---|---|---|---|
| <65 | 33.12% (184,499) | 32.92% (53,271) | 33.60% (32,320) | 33.17% (85,591) | 33.07% (98,908) |
| 65-69 | 30.77% (219,753) | 32.63% (82,726) | 30.40% (36,717) | 31.91% (119,443) | 29.51% (100,310) |
| 70-74 | 28.97% (352,036) | 31.33% (156,445) | 28.79% (55,279) | 30.63% (211,724) | 26.78% (140,312) |
| 75-79 | 29.57% (440,177) | 31.21% (228,827) | 29.67% (63,941) | 30.86% (292,768) | 27.31% (147,409) |
| 80-84 | 30.93% (483,764) | 31.95% (285,877) | 31.19% (64,373) | 31.81% (350,250) | 28.84% (133,514) |
| 85+ | 31.76% (878,475) | 31.48% (577,822) | 33.48% (107,639) | 31.77% (685,461) | 31.69% (193,014) |
By Sex
| Sex | Total | Highly Likely + Likely (1+ Specific Diagnoses) | Likely Dementia (1 Specific Diagnosis) | Highly Likely Dementia (2+ Specific Diagnoses) | Possible Dementia (Less Specific Diagnosis) |
|---|---|---|---|---|---|
| Male | 32.74% (1,000,852) | 34.45% (535,610) | 32.85% (147,009) | 34.09% (682,619) | 30.19% (318,233) |
| Female | 29.27% (1,373,353) | 29.91% (796,087) | 29.73% (180,940) | 29.87% (977,027) | 27.89% (396,326) |
By Race/Ethnicity
| Racial/Ethnic Identification | Total | Highly Likely + Likely (1+ Specific Diagnoses) | Likely Dementia (1 Specific Diagnosis) | Highly Likely Dementia (2+ Specific Diagnoses) | Possible Dementia (Less Specific Diagnosis) |
|---|---|---|---|---|---|
| African American | 34.39% (288,164) | 36.39% (172,439) | 33.75% (41,292) | 35.85% (213,731) | 30.80% (74,433) |
| American Indian/Alaskan Native | 35.09% (9,606) | 36.04% (5,253) | 34.10% (1,411) | 35.61% (6,664) | 33.96% (2,942) |
| Asian or Pacific Islander | 23.74% (59,485) | 25.45% (36,390) | 21.81% (9,010) | 24.64% (45,400) | 21.24% (14,085) |
| Hispanic (any race) | 26.93% (223,151) | 28.69% (137,877) | 25.61% (33,446) | 28.04% (171,323) | 23.82% (51,828) |
| Other | 28.05% (17,348) | 29.75% (10,025) | 27.40% (2,432) | 29.26% (12,457) | 25.39% (4,891) |
| Unknown | 25.12% (16,455) | 27.21% (7,301) | 24.59% (2,447) | 26.50% (9,748) | 23.35% (6,707) |
| White | 31.01% (1,759,996) | 31.62% (962,412 | 32.19% (237,911) | 31.73% (1,200,323) | 29.56% (559,673) |
Discharges Per 1,000 Among Medicare Beneficiaries Diagnosed with Dementia
Total
Prevalence indicated by count
| All Claims & Encounter Data | Total | Highly Likely + Likely (1+ Specific Diagnoses) | Likely Dementia (1 Specific Diagnosis) | Highly Likely Dementia (2+ Specific Diagnoses) | Possible Dementia (Less Specific Diagnosis) |
|---|---|---|---|---|---|
| Total | 501 | 510 | 516 | 508 | 483 |
By Program
| Program Name | Total | Highly Likely + Likely (1+ Specific Diagnoses) | Likely Dementia (1 Specific Diagnosis) | Highly Likely Dementia (2+ Specific Diagnoses) | Possible Dementia (Less Specific Diagnosis) |
|---|---|---|---|---|---|
| Medicare FFS | 535 | 544 | 573 | 537 | 515 |
| Medicare Advantage | 466 | 474 | 463 | 477 | 451 |
By Age
| Age Range | Total | Highly Likely + Likely (1+ Specific Diagnoses) | Likely Dementia (1 Specific Diagnosis) | Highly Likely Dementia (2+ Specific Diagnoses) | Possible Dementia (Less Specific Diagnosis) |
|---|---|---|---|---|---|
| <65 | 724 | 709 | 743 | 689 | 737 |
| 65-69 | 582 | 604 | 577 | 617 | 558 |
| 70-74 | 512 | 546 | 513 | 558 | 468 |
| 75-79 | 499 | 520 | 506 | 525 | 460 |
| 80-84 | 499 | 511 | 508 | 512 | 468 |
| 85+ | 479 | 477 | 507 | 472 | 486 |
By Sex
| Sex | Total | Highly Likely + Likely (1+ Specific Diagnoses) | Likely Dementia (1 Specific Diagnosis) | Highly Likely Dementia (2+ Specific Diagnoses) | Possible Dementia (Less Specific Diagnosis) |
|---|---|---|---|---|---|
| Male | 546 | 563 | 551 | 567 | 513 |
| Female | 473 | 477 | 491 | 474 | 461 |
By Race/Ethnicity
| Racial/Ethnic Identification | Total | Highly Likely + Likely (1+ Specific Diagnoses) | Likely Dementia (1 Specific Diagnosis) | Highly Likely Dementia (2+ Specific Diagnoses) | Possible Dementia (Less Specific Diagnosis) |
|---|---|---|---|---|---|
| African American | 617 | 639 | 609 | 646 | 563 |
| American Indian/Alaskan Native | 591 | 596 | 581 | 601 | 579 |
| Asian or Pacific Islander | 371 | 382 | 337 | 395 | 341 |
| Hispanic (any race) | 446 | 462 | 426 | 471 | 401 |
| Other | 456 | 471 | 448 | 477 | 421 |
| Unknown | 423 | 446 | 419 | 456 | 394 |
| White | 499 | 504 | 529 | 499 | 489 |
Any Short Stay Nursing Facility Visit Rate Among Medicare Beneficiaries Diagnosed with Dementia
Total
Prevalence indicated by both percentage and (count)
| All Claims & Encounter Data | Total | Highly Likely + Likely (1+ Specific Diagnoses) | Likely Dementia (1 Specific Diagnosis) | Highly Likely Dementia (2+ Specific Diagnoses) | Possible Dementia (Less Specific Diagnosis) |
|---|---|---|---|---|---|
| Total | 14.12% (1,093,911) | 16.78% (707,496) | 12.42% (131,217) | 15.91% (838,713) | 10.31% (255,198) |
By Program
| Program Name | Total | Highly Likely + Likely (1+ Specific Diagnoses) | Likely Dementia (1 Specific Diagnosis) | Highly Likely Dementia (2+ Specific Diagnoses) | Possible Dementia (Less Specific Diagnosis) |
|---|---|---|---|---|---|
| Medicare FFS | 15.33% (610,857) | 18.14% (402,256) | 14.09% (72,163) | 17.38% (474,419) | 10.87% (136,438) |
| Medicare Advantage | 12.83% (483,054) | 15.26% (305,240) | 10.85% (59,054) | 14.32% (364,294) | 9.73% (118,760) |
By Age
| Age Range | Total | Highly Likely + Likely (1+ Specific Diagnoses) | Likely Dementia (1 Specific Diagnosis) | Highly Likely Dementia (2+ Specific Diagnoses) | Possible Dementia (Less Specific Diagnosis) |
|---|---|---|---|---|---|
| <65 | 10.04% (55,943) | 12.77% (20,670) | 9.78% (9,409) | 11.66% (30,079) | 8.65% (25,864) |
| 65-69 | 11.28% (80,567) | 14.63% (37,093) | 10.61% (12,809) | 13.33% (49,902) | 9.02% (30,665) |
| 70-74 | 11.29% (137,248) | 14.80% (73,890) | 10.41% (19,985) | 13.58% (93,875) | 8.28% (43,373) |
| 75-79 | 12.34% (183,706) | 15.30% (112,183) | 10.92% (23,547) | 14.31% (135,730) | 8.89% (47,976) |
| 80-84 | 13.98% (218,618) | 16.40% (146,741) | 12.20% (25,179) | 15.61% (171,920) | 10.09% (46,698) |
| 85+ | 17.13% (473,772) | 18.39% (337,589) | 15.46% (49,697) | 17.95% (387,286) | 14.20% (86,486) |
By Sex
| Sex | Total | Highly Likely + Likely (1+ Specific Diagnoses) | Likely Dementia (1 Specific Diagnosis) | Highly Likely Dementia (2+ Specific Diagnoses) | Possible Dementia (Less Specific Diagnosis) |
|---|---|---|---|---|---|
| Male | 14.17% (433,189) | 17.66% (274,632) | 12.48% (55,854) | 16.50% (330,486) | 9.74% (102,703) |
| Female | 14.08% (660,722) | 16.26% (432,864) | 12.38% (75,363) | 15.54% (508,227) | 10.73% (152,495) |
By Race/Ethnicity
| Racial/Ethnic Identification | Total | Highly Likely + Likely (1+ Specific Diagnoses) | Likely Dementia (1 Specific Diagnosis) | Highly Likely Dementia (2+ Specific Diagnoses) | Possible Dementia (Less Specific Diagnosis) |
|---|---|---|---|---|---|
| African American | 14.62% (122,547) | 17.32% (82,087) | 12.52% (15,320) | 16.34% (97,407) | 10.40% (25,140) |
| American Indian/Alaskan Native | 14.34% (3,926) | 17.00% (2,478) | 13.70% (567) | 16.27% (3,045) | 10.17% (881) |
| Asian or Pacific Islander | 8.25% (20,675) | 10.15% (14,510) | 6.18% (2,555) | 9.26% (17,065) | 5.44% (3,610) |
| Hispanic (any race) | 8.01% (66,406) | 9.64% (46,342) | 6.11% (7,981) | 8.89% (54,323) | 5.55% (12,083) |
| Other | 10.90% (6,743) | 13.12% (4,421) | 9.18% (815) | 12.30% (5,236) | 7.82% (1,507) |
| Unknown | 8.80% (5,764) | 11.77% (3,159) | 7.90% (786) | 10.72% (3,945) | 6.33% (1,819) |
| White | 15.29% (867,850) | 18.22% (554,499) | 13.96% (103,193) | 17.38% (657,692) | 11.10% (210,158) |
Any Long Stay Nursing Facility Visit Rate Among Medicare Beneficiaries Diagnosed with Dementia
Total
Prevalence indicated by both percentage and (count)
| All Claims & Encounter Data | Total | Highly Likely + Likely (1+ Specific Diagnoses) | Likely Dementia (1 Specific Diagnosis) | Highly Likely Dementia (2+ Specific Diagnoses) | Possible Dementia (Less Specific Diagnosis) |
|---|---|---|---|---|---|
| Total | 9.42% (730,048) | 14.67% (618,684) | 4.62% (48,780) | 12.66% (667,464) | 2.53% (62,584) |
By Program
| Program Name | Total | Highly Likely + Likely (1+ Specific Diagnoses) | Likely Dementia (1 Specific Diagnosis) | Highly Likely Dementia (2+ Specific Diagnoses) | Possible Dementia (Less Specific Diagnosis) |
|---|---|---|---|---|---|
| Medicare FFS | 11.72% (467,147) | 17.90% (396,915) | 6.10% (31,237) | 15.69% (428,152) | 3.11% (38,995) |
| Medicare Advantage | 6.99% (262,901) | 11.09% (221,769) | 3.22% (17,543) | 9.41% (239,312) | 1.93% (23,589) |
By Age
| Age Range | Total | Highly Likely + Likely (1+ Specific Diagnoses) | Likely Dementia (1 Specific Diagnosis) | Highly Likely Dementia (2+ Specific Diagnoses) | Possible Dementia (Less Specific Diagnosis) |
|---|---|---|---|---|---|
| <65 | 9.87% (54,969) | 20.60% (33,327) | 8.33% (8,010) | 16.02% (41,337) | 4.56% (13,632) |
| 65-69 | 8.60% (61,437) | 17.27% (43,771) | 5.99% (7,237) | 13.63% (51,008) | 3.07% (10,429) |
| 70-74 | 7.59% (92,218) | 14.25% (71,174) | 4.68% (8,977) | 11.59% (80,151) | 2.30% (12,067) |
| 75-79 | 7.56% (112,502) | 12.73% (93,360) | 3.89% (8,386) | 10.72% (101,746) | 1.99% (10,756) |
| 80-84 | 8.34% (130,469) | 12.73% (113,885) | 3.68% (7,602) | 11.03% (121,487) | 1.94% (8,982) |
| 85+ | 12.05% (333,422) | 16.15% (296,494) | 5.16% (16,578) | 14.51% (313,072) | 3.34% (20,350) |
By Sex
| Sex | Total | Highly Likely + Likely (1+ Specific Diagnoses) | Likely Dementia (1 Specific Diagnosis) | Highly Likely Dementia (2+ Specific Diagnoses) | Possible Dementia (Less Specific Diagnosis) |
|---|---|---|---|---|---|
| Male | 7.68% (234,660) | 12.33% (191,770) | 4.24% (18,981) | 10.52% (210,751) | 2.27% (23,909) |
| Female | 10.56% (495,388) | 16.04% (426,914) | 4.90% (29,799) | 13.96% (456,713) | 2.72% (38,675) |
By Race/Ethnicity
| Racial/Ethnic Identification | Total | Highly Likely + Likely (1+ Specific Diagnoses) | Likely Dementia (1 Specific Diagnosis) | Highly Likely Dementia (2+ Specific Diagnoses) | Possible Dementia (Less Specific Diagnosis) |
|---|---|---|---|---|---|
| African American | 11.51% (96,474) | 17.36% (82,283) | 5.55% (6,790) | 14.94% (89,073) | 3.06% (7,401) |
| American Indian/Alaskan Native | 11.70% (3,203) | 18.19% (2,651) | 6.16% (255) | 15.53% (2,906) | 3.43% (297) |
| Asian or Pacific Islander | 5.61% (14,049) | 8.62% (12,317) | 2.24% (927) | 7.19% (13,244) | 1.21% (805) |
| Hispanic (any race) | 5.48% (45,379) | 8.36% (40,181) | 1.93% (2,524) | 6.99% (42,705) | 1.23% (2,674) |
| Other | 6.40% (3,956) | 10.06% (3,391) | 2.94% (261) | 8.58% (3,652) | 1.58% (304) |
| Unknown | 4.76% (3,118) | 9.04% (2,427) | 2.85% (284) | 7.37% (2,711) | 1.42% (407) |
| White | 9.93% (563,869) | 15.62% (475,434) | 5.11% (37,739) | 13.56% (513,173) | 2.68% (50,696) |
Average Annual All-Cause Payments Among Medicare FFS Beneficiaries Diagnosed with Dementia
Total
Average payments indicated by dollar amount
| All Claims & Encounter Data | Total | Highly Likely + Likely (1+ Specific Diagnoses) | Likely Dementia (1 Specific Diagnosis) | Highly Likely Dementia (2+ Specific Diagnoses) | Possible Dementia (Less Specific Diagnosis) |
|---|---|---|---|---|---|
| Total | NA | NA | NA | NA | NA |
By Program
| Program Name | Total | Highly Likely + Likely (1+ Specific Diagnoses) | Likely Dementia (1 Specific Diagnosis) | Highly Likely Dementia (2+ Specific Diagnoses) | Possible Dementia (Less Specific Diagnosis) |
|---|---|---|---|---|---|
| Medicare FFS | $26,270 | $27,085 | $27,456 | $25,479 | $24,500 |
| Medicare Advantage | NA | NA | NA | NA | NA |
By Age (FFS Only)
| Age Range | Total | Highly Likely + Likely (1+ Specific Diagnoses) | Likely Dementia (1 Specific Diagnosis) | Highly Likely Dementia (2+ Specific Diagnoses) | Possible Dementia (Less Specific Diagnosis) |
|---|---|---|---|---|---|
| <65 | $33,539 | $34,480 | $34,229 | $34,980 | $32,674 |
| 65-69 | $30,336 | $31,960 | $32,917 | $29,702 | $28,518 |
| 70-74 | $27,665 | $29,589 | $30,369 | $27,404 | $25,182 |
| 75-79 | $26,598 | $27,849 | $28,329 | $26,110 | $24,459 |
| 80-84 | $25,848 | $26,780 | $27,130 | $25,177 | $23,655 |
| 85+ | $24,916 | $25,533 | $25,951 | $23,042 | $22,707 |
By Sex (FFS Only)
| Sex | Total | Highly Likely + Likely (1+ Specific Diagnoses) | Likely Dementia (1 Specific Diagnosis) | Highly Likely Dementia (2+ Specific Diagnoses) | Possible Dementia (Less Specific Diagnosis) |
|---|---|---|---|---|---|
| Male | $28,208 | $29,172 | $29,663 | $27,345 | $26,360 |
| Female | $25,012 | $25,817 | $26,178 | $24,094 | $23,108 |
By Race/Ethnicity (FFS Only)
| Racial/Ethnic Identification | Total | Highly Likely + Likely (1+ Specific Diagnoses) | Likely Dementia (1 Specific Diagnosis) | Highly Likely Dementia (2+ Specific Diagnoses) | Possible Dementia (Less Specific Diagnosis) |
|---|---|---|---|---|---|
| African American | $32,632 | $33,544 | $33,910 | $31,839 | $29,910 |
| American Indian/Alaskan Native | $29,262 | $29,232 | $29,760 | $27,286 | $29,330 |
| Asian or Pacific Islander | $23,967 | $24,969 | $26,138 | $20,577 | $21,088 |
| Hispanic (any race) | $27,883 | $28,971 | $29,992 | $24,719 | $24,635 |
| Other | $26,058 | $27,268 | $27,793 | $25,081 | $23,347 |
| Unknown | $24,538 | $26,101 | $27,110 | $23,258 | $22,500 |
| White | $25,583 | $26,267 | $26,536 | $25,093 | $24,177 |